Line Plot
lineplot.RdGenerate a flexible longitudinal/spaghetti plot for endpoint analysis with options to facet and add marker lines
lineplot(data, x, y, group_by = aggr, facet = NULL, stat = NULL,
  aggr = "USUBJID", show_n = TRUE, log_y = FALSE, title = "",
  xlab = "Visit Day", ylab = "AVAL", symb = NULL, markers = NULL,
  caption = "", size = "small", max_lvl = 8)
Arguments
| data | a dataframe containing the input data to plot (dataframe) |
|---|---|
| x | column name for x-axis parameter (string) |
| y | column name for y-axis parameter (string) |
| group_by | a column name containing a subgrouping factor to split the plot by (string) |
| facet | optional parameter, column name containing a subgrouping factor to facet the plot by (string) |
| stat | optional parameter, type of summary statistic to compute on y-variable, choose "mean" or "median" if y is not already summary-level data (string) |
| aggr | column name used to compute aggregate counts (n = ) in legend, default is "USUBJID" (string) |
| show_n | boolean parameter for displaying counts from aggr, default is TRUE (logical) |
| log_y | optional parameter, boolean for whether to use a log scale for y-axis, default is FALSE (logical) |
| title | optional parameter, custom plot title (string) |
| xlab | optional parameter, custom x-axis plot label (string) |
| ylab | optional parameter, custom y-axis plot label (string) |
| symb | optional parameter to shape markers by a factor type column (string) |
| markers | optional parameter, list of special interest x-axis values to display vertical dashed marker lines (numeric list/series) |
| caption | optional string to include as a caption on bottom of plot (string) |
| size | optional string to specify font size schema ("small" for PDF usage or "large" for Shiny apps) to use for plot, default is "small" (string) |
| max_lvl | optional parameter, maximum levels group_by can have before legend is hidden (integer) |
Value
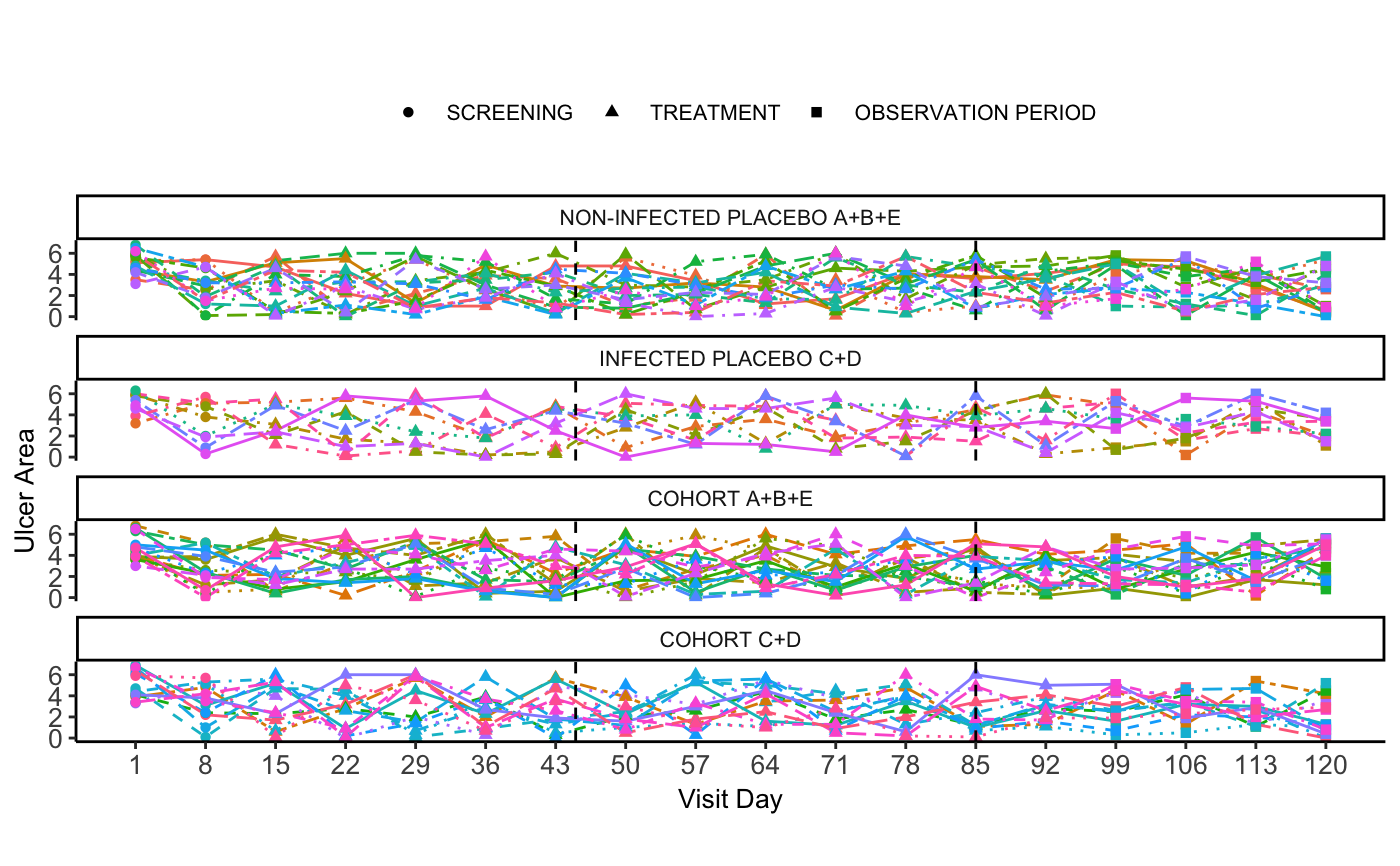
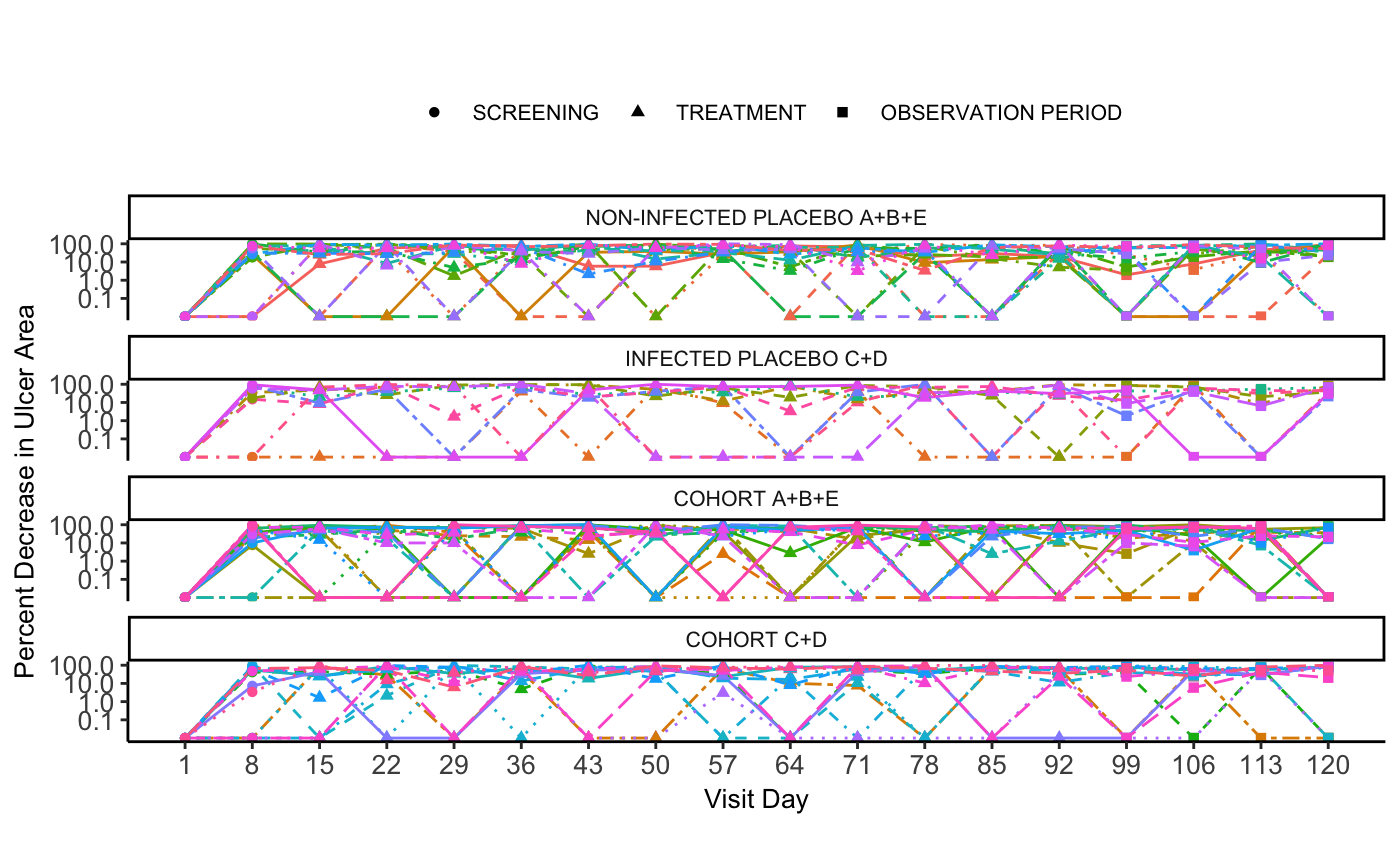
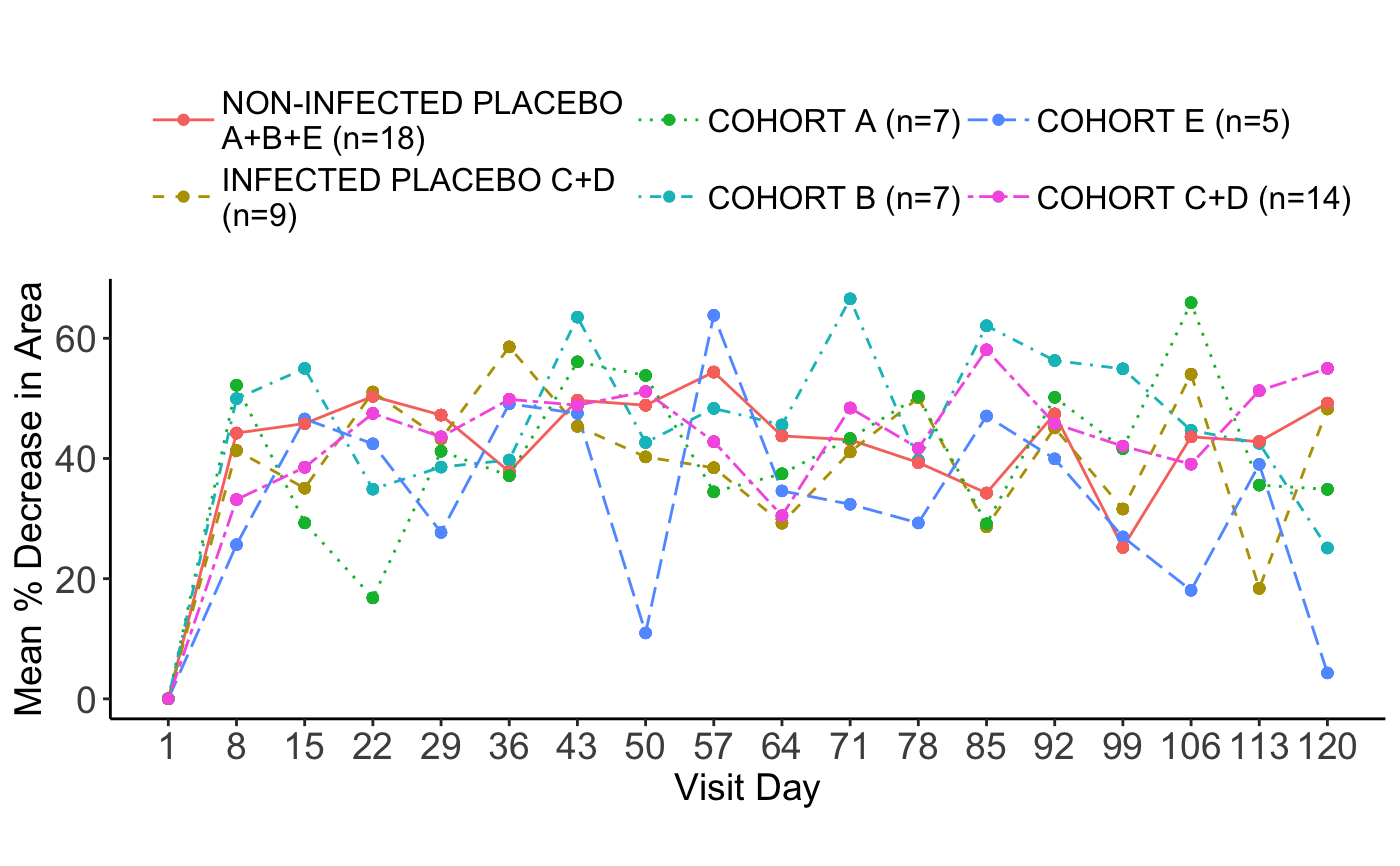
produces a line plot with study endpoint measurements over time
Examples
lineplot(data = AZA, x = "ADY", y = "AVAL", group_by = "USUBJID", facet = "CHRTGRP",
  symb = "EPOCH", markers = c(45, 85), ylab = "Ulcer Area")lineplot(data = AZA, x = "ADY", y = "PDCR", group_by = "USUBJID", facet = "CHRTGRP", log_y = TRUE,
  symb = "EPOCH", ylab = "Percent Decrease in Ulcer Area")lineplot(data = AZA, x = "ADY", y = "PDCR", group_by = "CHRT",
  stat = "mean", ylab = "Mean % Decrease in Area", size = "large")