Gradient Plot
grdplot.RdGenerate a flexible gradient plot (heatmap or bubble plot) for efficacy analysis
grdplot(type = "heat", data, x, y, facet = NULL, ord,
  ord_lbl = "USUBJID", reverse = FALSE, ncol = 3, title = "",
  xlab = "Subjects", ylab = "Study Day", leglab = "", caption = "",
  size = "small")
Arguments
| type | use either "heat" or "bubble", controls the type of plot produced (string) |
|---|---|
| data | a dataframe containing the input data to plot (dataframe) |
| x | column name for x-axis parameter (string) |
| y | column name for y-axis parameter (string) |
| facet | optional parameter, column name containing a subgrouping factor to facet the plot by (string) |
| ord | column name for factor level parameter to order color gradient by (string) |
| ord_lbl | column name for parameter that contains x-axis labels (ord column labels) (string) |
| reverse | optional boolean parameter for flipping the size of the bubbles and for "negative" measurements like decrease/percent decrease (logic) |
| ncol | optional parameter to control number of facets to display in a row if facet variable is provided, must be at least 1, default value is 3 (integer) |
| title | optional parameter, custom plot title (string) |
| xlab | optional parameter, custom x-axis plot label (string) |
| ylab | optional parameter, custom y-axis plot label (string) |
| leglab | descriptive label for heat map legend (string) |
| caption | optional string to include as a caption on bottom of plot (string) |
| size | optional string to specify font size schema ("small" for PDF usage or "large" for Shiny apps) to use for plot, default is "small" (string) |
Value
produces a gradient plot with optional facet parameters
Examples
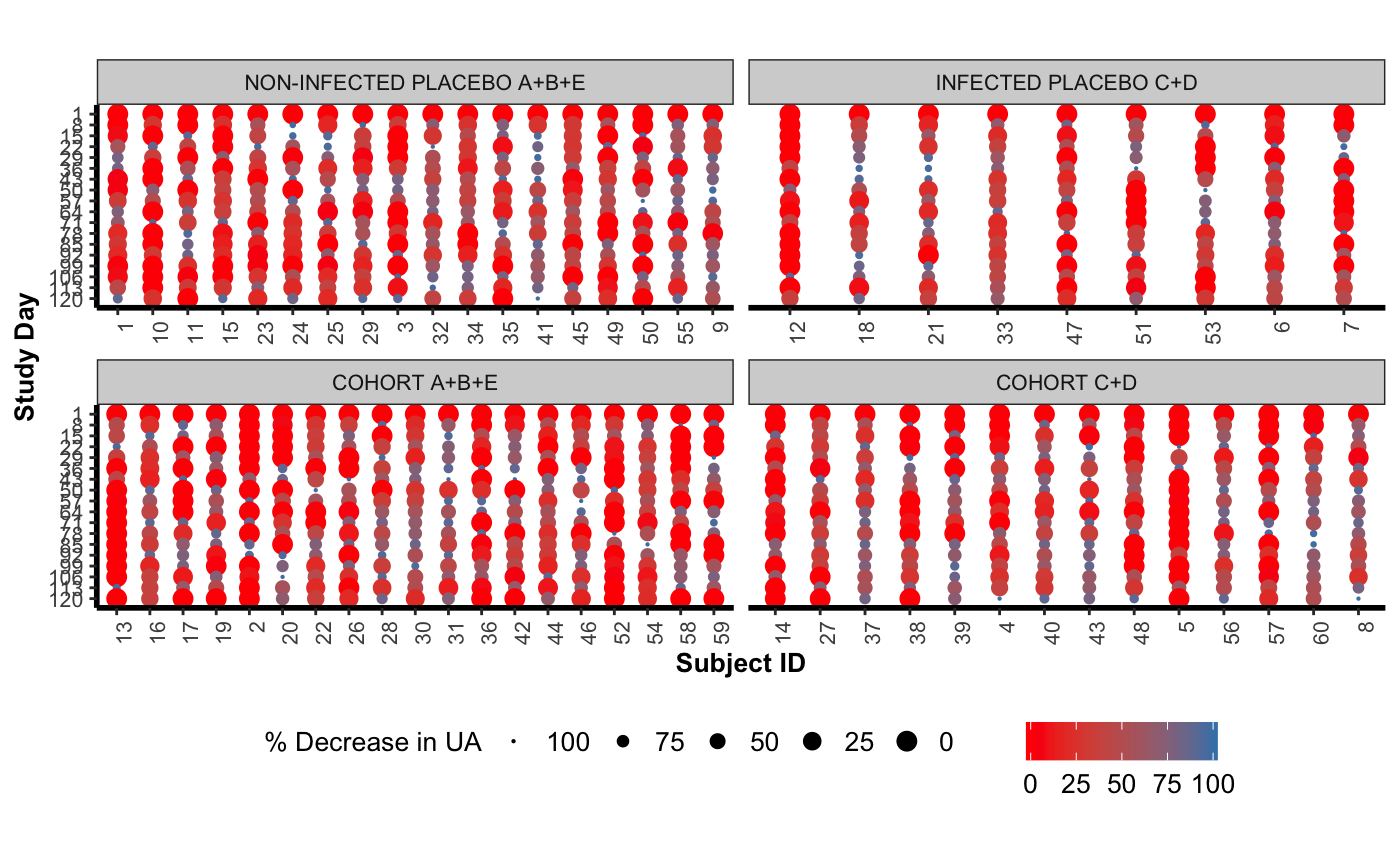
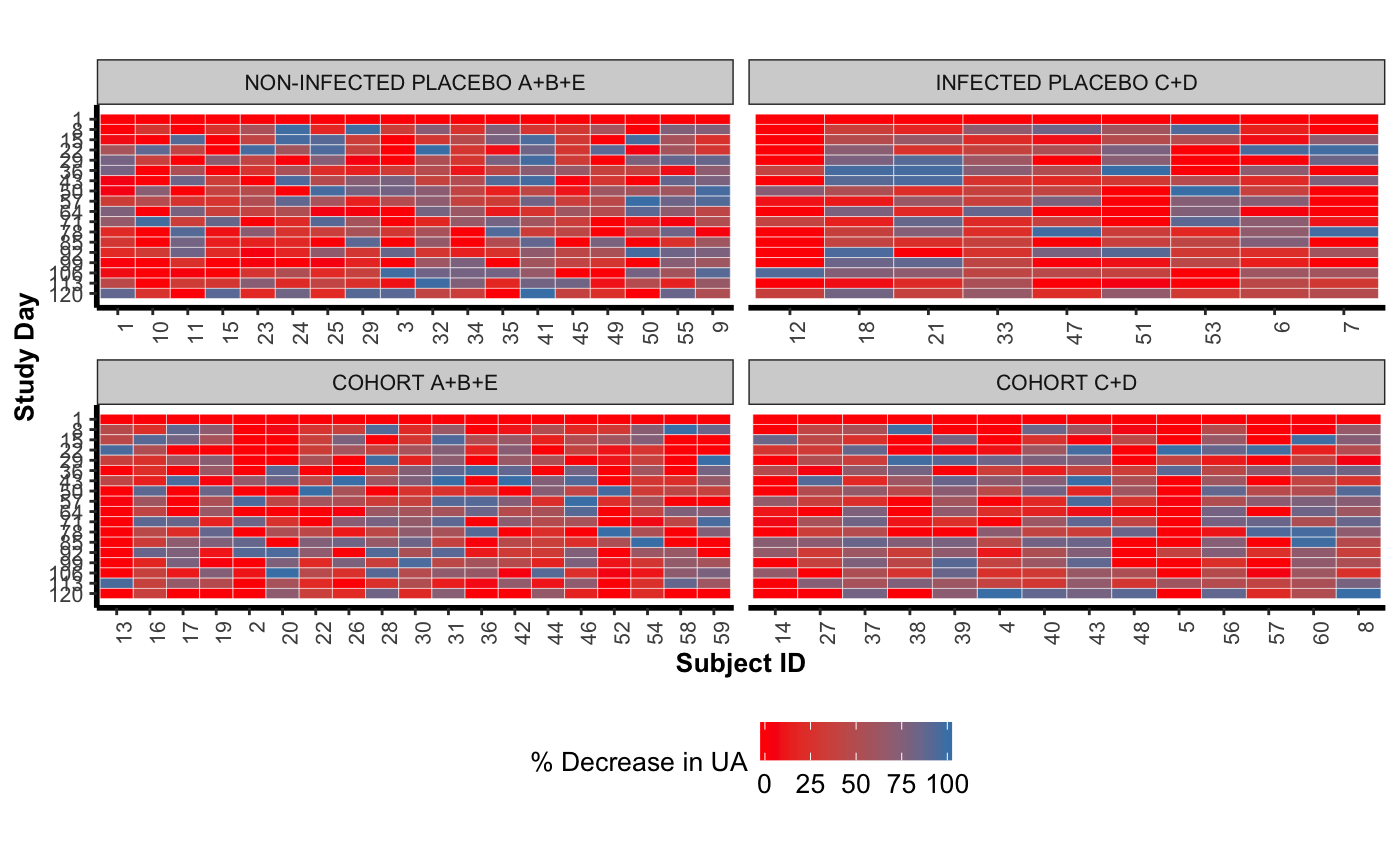
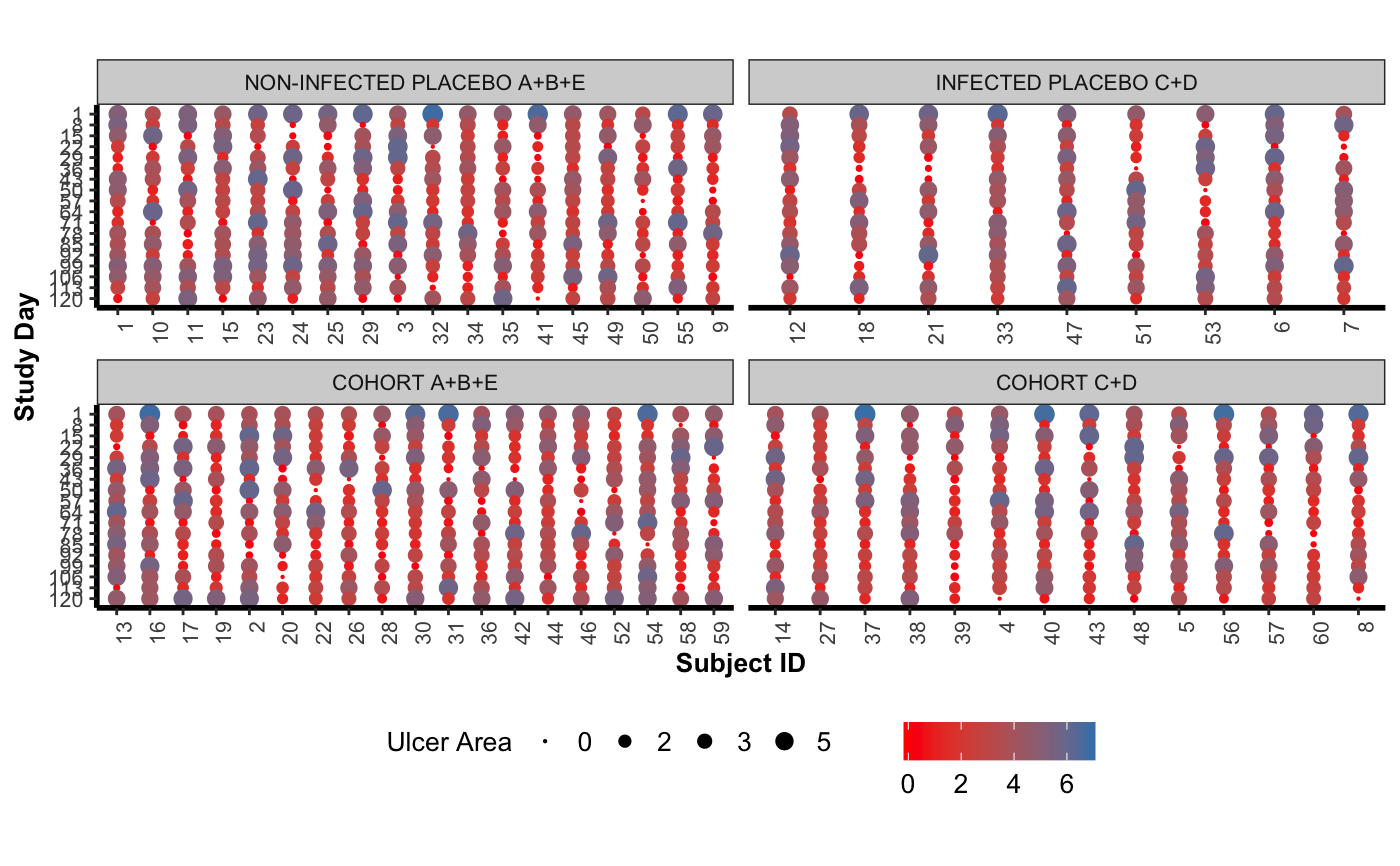
grdplot( type = "bubble", data = AZA, x = "RANK", y = "ADY", facet = "CHRTGRP", ord = "PDCR", reverse=TRUE, ncol = 2, xlab = "Subject ID", leglab = "% Decrease in UA" )grdplot( type = "heat", data = AZA, x = "RANK", y = "ADY", facet = "CHRTGRP", ord = "PDCR", reverse=TRUE, ncol = 2, xlab = "Subject ID", leglab = "% Decrease in UA" )grdplot( type = "bubble", data = AZA, x = "RANK", y = "ADY", facet = "CHRTGRP", ord = "AVAL", ncol = 2, xlab = "Subject ID", leglab = "Ulcer Area" )