Box Plot
boxplot.RdGenerate a flexible box plot for endpoint analysis
boxplot(data, group_by, y, color_by, color_lbl = TRUE, facet = NULL,
  aggr = "USUBJID", show_n = TRUE, title = "", xlab = "Visit Day",
  ylab = "AVAL", caption = "", size = "small")
Arguments
| data | a dataframe containing the input data to plot (dataframe) |
|---|---|
| group_by | x-axis grouping factor variable (string) |
| y | column name for y-axis parameter (string) |
| color_by | factor variable to color by (string) |
| color_lbl | boolean to determine whether or not to display the column name used as color label, default is TRUE (logical) |
| facet | optional parameter, column name containing a subgrouping factor to facet the plot by (string) |
| aggr | column name used to compute aggregate counts (n = ) in legend, default is "USUBJID" (string) |
| show_n | boolean parameter for displaying counts from aggr, default is TRUE (logical) |
| title | optional parameter, custom plot title (string) |
| xlab | optional parameter, custom x-axis plot label (string) |
| ylab | optional parameter, custom y-axis plot label (string) |
| caption | optional string to include as a caption on bottom of plot (string) |
| size | optional string to specify font size schema ("small" for PDF usage or "large" for Shiny apps) to use for plot, default is "small" (string) |
Value
produces a box plot with optional facet parameters
Examples
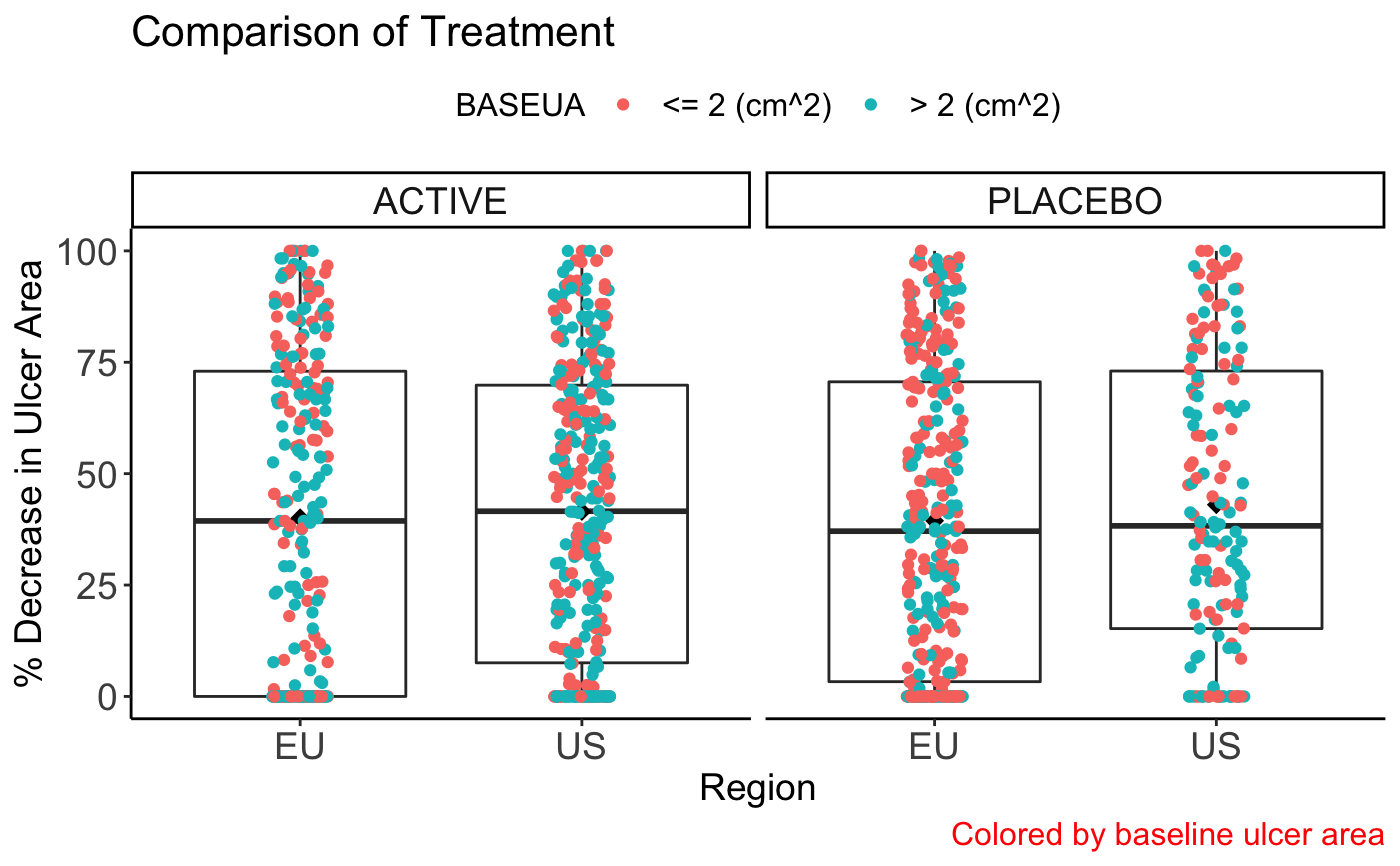
boxplot(
  data = AZA, group_by = "REGION", y = "PDCR", color_by = "BASEUA", facet = "TRT",
  show_n = FALSE, title = "Comparison of Treatment", xlab = "Region",
  ylab = "% Decrease in Ulcer Area",
  caption = "Colored by baseline ulcer area", size = "large"
)